BLOGTHINGS TO KNOW ABOUT POINT AND FIGURE CHARTS
THINGS TO KNOW ABOUT POINT AND FIGURE CHARTS
Uploaded by : DreamGains Financials, Posted on : 23 Sep 2016
- On point and Figure Charts X’s represent up movements which are called boxes.
- On point and Figure charts O’s represent down movements which are called boxes.
- Box-size is pre-determined either as a price or a tick.
- Price action is represented by the Y-axis.
- A column of X’s or O’s represent a supply/demand.
- Reversal plot takes place when the price action is changed by a number of boxes. (3-box).
- Sensitivity of the chart is altered by varying the box size.
- Price Changes less than the pre-selected price/tick size is ignored.
- There is no time on horizontal axis; time is not represented with the PF.
- There is no volume representation.
- Gaps are not recorded. If the price gaps away all the boxes are filled in.
- Catapult is defined as a break out and pull-back into the pattern.
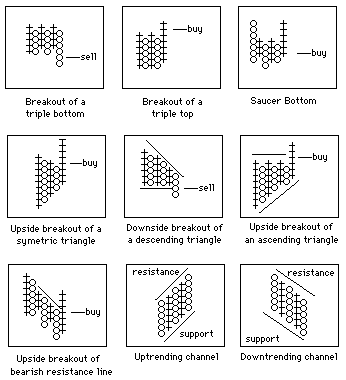
- Trendlines are vital part of 3 box reversal analysis and are drawn at a 45 degree angle as a Bullish Support (up trendline) and a Bearish Resistance (down trendline). These trend lines are drawn from an important low or high point of the chart.
- The 1st Point & Figure charts used a reversal amount equal to 1 box size. These are called 1-box reversal charts to distinguish them from the newer and simpler 3-box reversal charts.


