- Flags and Pennants
Flags and Pennants are short-term continuation patterns that mark a minor consolidation before the previous trend resumes. These patterns are usually preceded by a sharp advance or decline with heavy volume, and mark a mid- point of the move.
Sharp Move: To be considered a continuation pattern, there should be evidence of a prior trend. Flags and pennants require evidence of a sharp advance or decline on heavy volume. These moves usually occur on heavy volume and can contain gaps. This move usually represents the first leg of a significant advance or decline and the flag/pennant is merely a pause.
Flagpole: The flagpole is the distance from the first resistance or support break to the high or low of the flag/pennant. The sharp advance (or decline) that forms the flagpole should break a trend line or resistance/support level. A line extending up from this break to the high of the flag/pennant forms the flagpole.
Flag: A flag is a small rectangle pattern that slopes against the previous trend. If the previous move was up, then the flag would slope down. If the move was down, then the flag would slope up. Because flags are usually too short in duration to actually have reaction highs and lows, the price action just needs to be contained within two parallel trend lines.
Pennant: A pennant is a small symmetrical triangle that begins wide and converges as the pattern matures (like a cone). The slope is usually neutral. Sometimes there will not be specific reaction highs and lows from which to draw the trend lines and the price action should just be contained within the converging trend lines.
Duration: Flags and pennants are short-term patterns that can last from 1 to 12 weeks. There is some debate on the timeframe and some consider 8 weeks to be pushing the limits for a reliable pattern. Ideally, these patterns will form between 1 and 4 weeks. Once a flag becomes more than 12 weeks old, it would be classified as a rectangle. A pennant more than 12 weeks old would turn into a symmetrical triangle. The reliability of patterns that fall between 8 and 12 weeks is debatable.
Break: For a bullish flag or pennant, a break above resistance signals that the previous advance has resumed. For a bearish flag or pennant, a break below support signals that the previous decline has resumed.
Volume: Volume should be heavy during the advance or decline that forms the flagpole. Heavy volume provides legitimacy for the sudden and sharp move that creates the flagpole. An expansion of volume on the resistance (support) break lends credence to the validity of the formation and the likelihood of continuation.
Targets: The length of the flagpole can be applied to the resistance break or support break of the flag/pennant to estimate the advance or decline. Even though flags and pennants are common formations, identification guidelines should not be taken lightly. It is important that flags and pennants are preceded by a sharp advance or decline. Without a sharp move, the reliability of the formation becomes questionable and trading could carry added risk. Look for volume confirmation on the initial move, consolidation and resumption to augment the robustness of pattern identification.
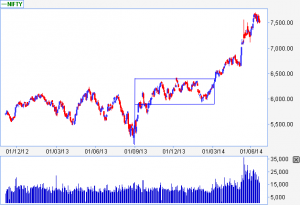
In the above daily chart of NIFTY, the flag pattern was formed in the year 2013-14 where it took around 6 months to form and the target of which was also achieved after the breakout.
Volumes were also rising and heavy during the formation of flagpole and tend to decline during consolidation. The expansion of volumes were seen as soon as the breakout happened.
- Rounding Bottom
The rounding bottom is a long-term reversal pattern that is best suited for weekly charts. It is also referred to as a saucer bottom, and represents a long consolidation period that turns from a bearish bias to a bullish bias.
Prior Trend: In order to be a reversal pattern, there must be a prior trend to reverse. Ideally, the low of a rounding bottom will mark a new low or reaction low. In practice, there are occasions when the low is recorded many months earlier and the security trades flat before forming the pattern. When the rounding bottom does finally form, its low may not be the lowest low of the last few months.
Decline: The first portion of the rounding bottom is the decline that leads to the low of the pattern. This decline can take on different forms: some are quite jagged with a number of reaction highs and lows, while others trade lower in a more linear fashion.
Low: The low of the rounding bottom can resemble a “V’ bottom, but should not be too sharp and should take a few weeks to form. Because prices are in a long-term decline, the possibility of a selling climax exists that could create a lower spike.
Advance: The advance off of the lows forms the right half of the pattern and should take about the same amount of time as the prior decline. If the advance is too sharp, then the validity of a rounding bottom may be in question.
Breakout: Bullish confirmation comes when the pattern breaks above the reaction high that marked the beginning of the decline at the start of the pattern. As with most resistance breakouts, this level can become support. However, rounding bottoms represent long-term reversal and this new support level may not be that significant.
Volume: In an ideal pattern, volume levels will track the shape of the rounding bottom: high at the beginning of the decline, low at the end of the decline and rising during the advance. Volume levels are not too important on the decline, but there should be an increase in volume on the advance and preferably on the breakout.
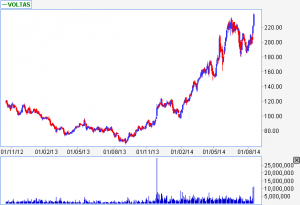
In the above daily chart of VOLTAS, the rounding bottom was formed and stock rose and was multiplied from there.
Volumes were also confirming where during the pattern formation volumes were high at the beginning of the decline and were at their lows when bottom was formed and when stock started rising volumes also started expanding.
A rounding bottom could be thought of as a head and shoulders bottom without readily identifiable shoulders. The head represents the low and is fairly central to the pattern. The volume patterns are similar and confirmation comes with a resistance breakout. While symmetry is preferable on the rounding bottom, the left and right side do not have to be equal in time or slope. The important thing is to capture the essence of the pattern.


